
On this page
- Before you compare
- Three events can produce seven detail rows
- The three events
- Reconcile the headline numbers
- A drawer count has its own filters
- Card search and row search answer different questions
- The displayed date may differ from the filter date
- Check the date field as well as the date range
- Analytics uses local range endpoints and UTC day buckets
- Views, visitors and sessions are different units
- Outcome totals are independent of traffic filters
- Confirm a successful load before concluding zero
- When the totals still differ
- Summary
Before you compare
Three events can produce seven detail rows
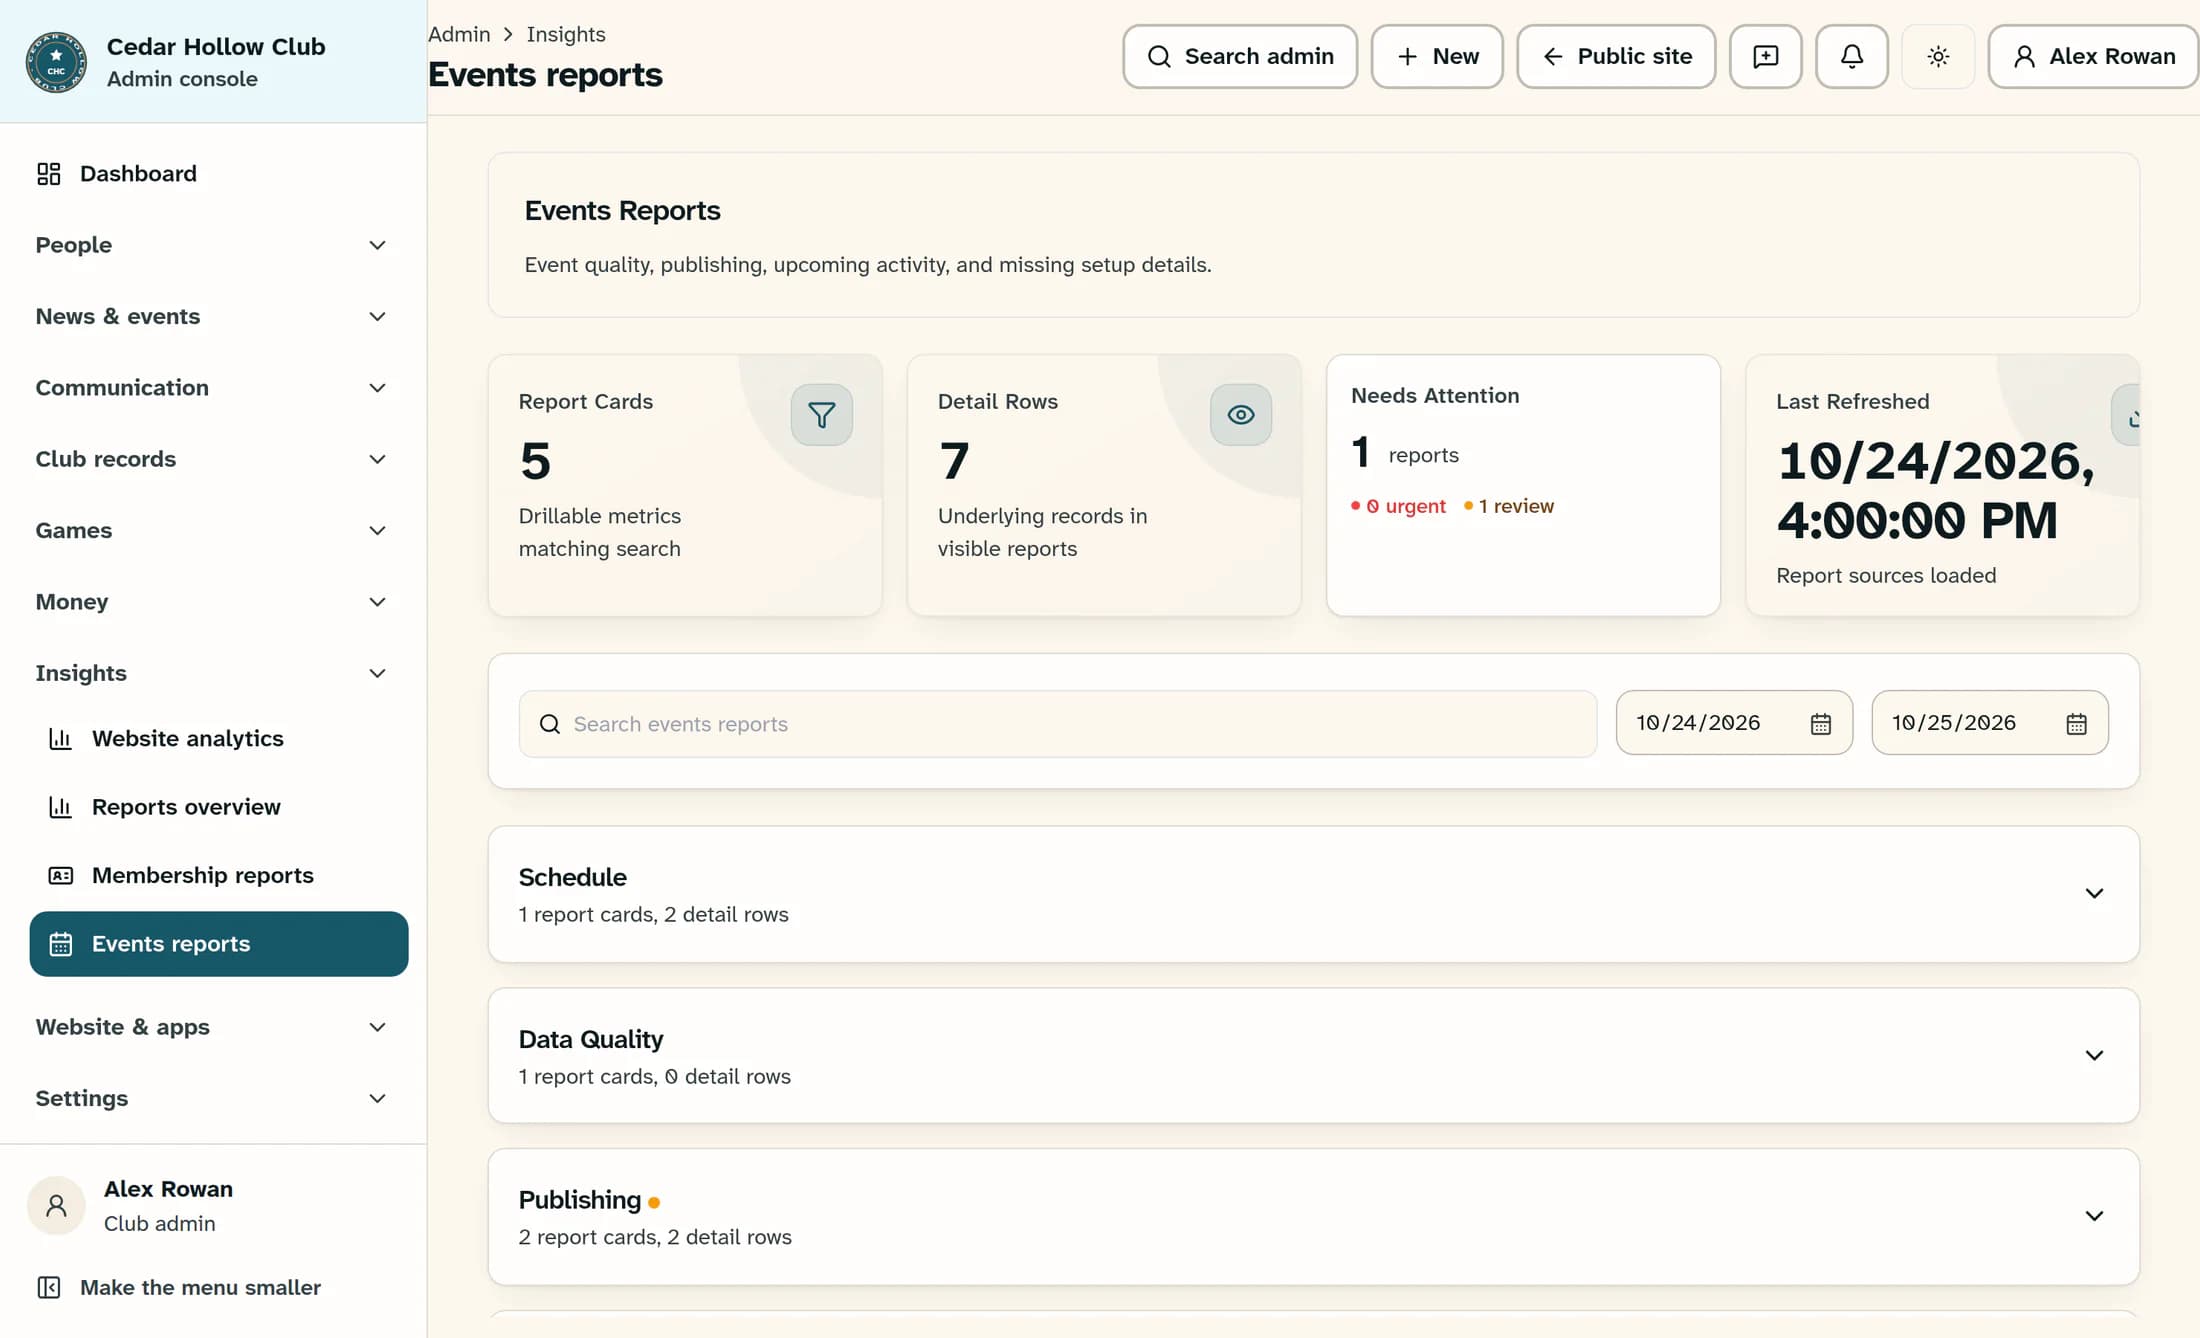
Open Events Reports from the admin navigation and enter October 24, 2026 in Report date from and October 25, 2026 in Report date to. Leave the page’s card search empty, then expand Operations if needed; the illustrated example uses a fixed report clock of October 24 at 4:00 PM in New York. The three fictional events below all require registration and have descriptions.
The three events
- A — Night Social starts October 24 at 11:30 PM New York time, is published and featured, and is still upcoming at the fixed report clock.
- B — Sunday Lunch starts October 25 at 3:00 PM New York time, is published and not featured, and is also upcoming.
- C — Morning Workshop started October 24 at 9:00 AM New York time, is a draft and not featured, and is no longer upcoming.
Reconcile the headline numbers
Report Cards is 5: Upcoming Events has A and B (2), Events Missing Description has none (0), Draft Events has C (1), Featured Events has A (1), and Registration Required has A, B and C (3). Detail Rows is therefore 2 + 0 + 1 + 1 + 3 = 7 report memberships, representing just three unique events. Needs Attention is 1 because only the nonempty Draft Events report has a review or urgent tone; it counts reports needing attention, not events.
A drawer count has its own filters
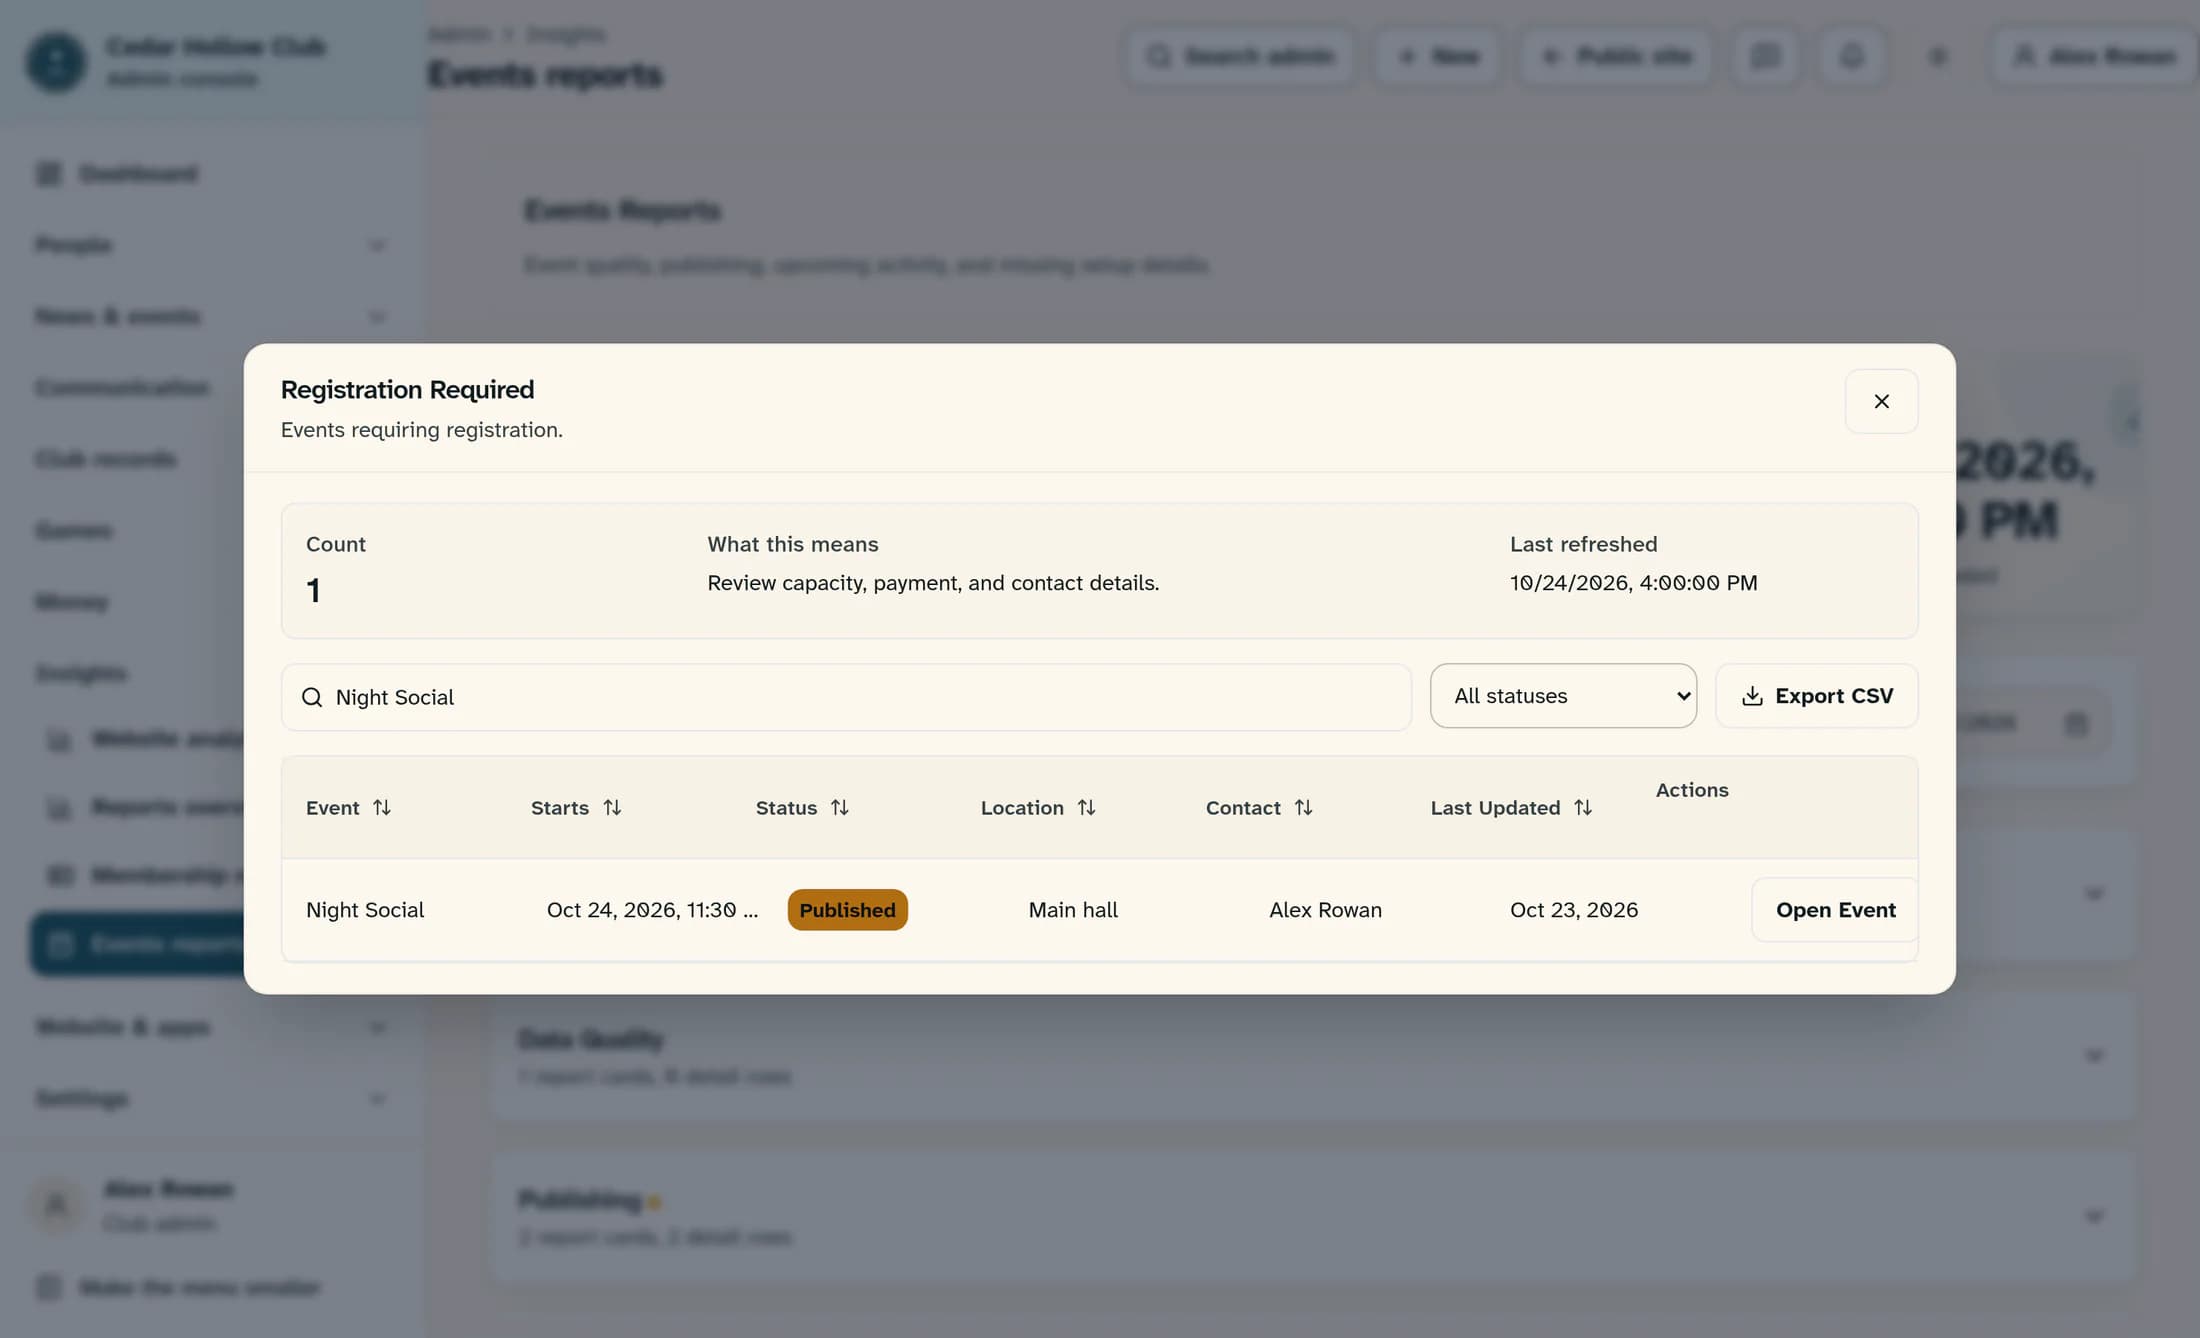
In Operations, open Registration Required using View details, then enter Night Social in Search names, emails, status, dates, or numbers and leave Detail status filter at All statuses. Count falls from 3 to 1 because the drawer now contains only A; the page totals stay at 5 cards, 7 detail rows and 1 report needing attention. Registration Required counts events with registration turned on, not registrations, guests or attendance.
Card search and row search answer different questions
The page’s card search matches report groups, titles, descriptions and counts; it changes Report Cards and Detail Rows to reflect the matching reports. Needs Attention still considers all reports in that family within the selected range. The drawer’s search and status filter affect only its Count and rows.
The displayed date may differ from the filter date
Night Social is stored at 2026-10-25T03:30:00Z, which displays as October 24 at 11:30 PM in New York. Choose Close before changing the page dates; set both Report date from and Report date to to October 24 to see why this event is excluded. Classic Reports compares the first ten characters of the stored event start value—October 25 here—while Starts uses your browser’s local time.
Check the date field as well as the date range
With October 24 alone, this fixture leaves only C: Report Cards remains 5, Detail Rows becomes 2 (C in Draft Events and Registration Required), and Needs Attention remains 1. Restoring Report date to to October 25 includes A and B again; the illustrated 5/7/1 totals return. Other report families may use creation, publication, payment or due dates, and some reports describe current state rather than a dated history.
Analytics uses local range endpoints and UTC day buckets
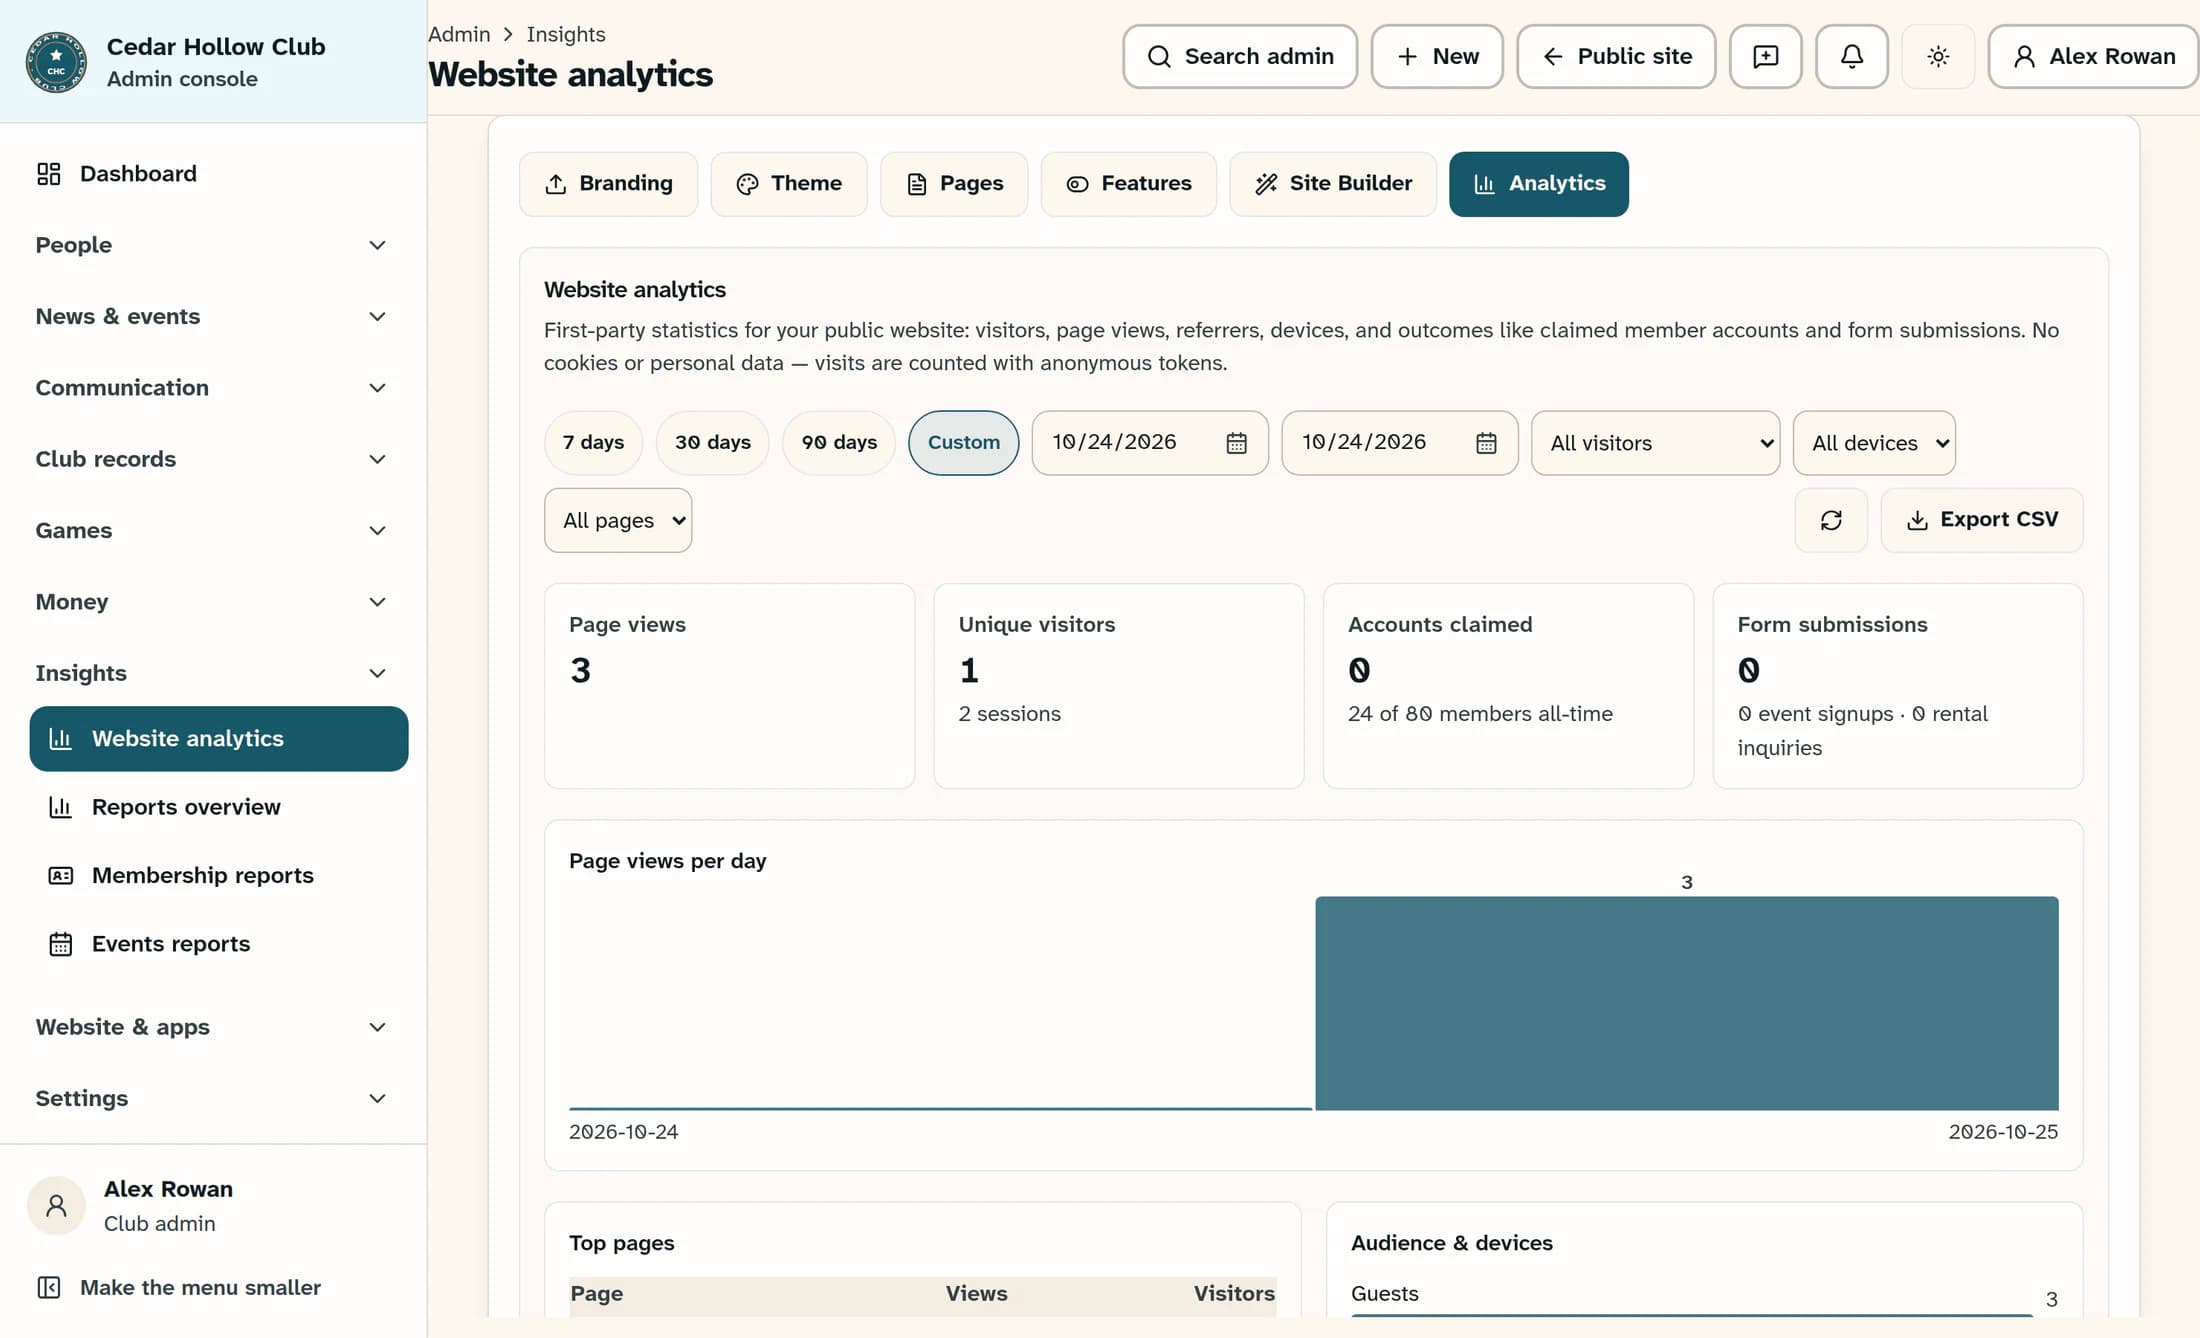
Open Website Analytics, choose Custom, and enter October 24, 2026 in both From date and To date; keep Audience, Device and Page at their all-options. In a New York browser this range runs from October 24 at 00:00:00 to 23:59:59 locally, or October 24 at 04:00:00Z through October 25 at 03:59:59Z. A separate fictional website visit at 2026-10-25T03:30:00Z is inside that range, but appears under October 25 in Page views per day, whose day keys use UTC.
Views, visitors and sessions are different units
The separate analytics snapshot is October 25, 2026 at 10:00 AM in New York; its visits have already happened. In the analytics illustration, one anonymous visitor token records two page views in one session and one more in a later session, all late on October 24 in New York. That yields 3 Page views, 1 Unique visitors and 2 sessions, with all three views in the October 25 UTC chart bucket. These visit records are separate from A, B and C; a shared timestamp does not connect a visit to an event or prove attendance, and a visitor token is not a verified person.
Outcome totals are independent of traffic filters
Accounts claimed, Form submissions, event signups and rental inquiries come from separate club-wide queries. Their range counts use their own activity dates and do not follow the traffic Audience, Device or Page filters; the all-time account and membership figures also ignore the selected range. They are not conversions attributed to the visits in the chart, so a traffic filter can reduce views without reducing these outcomes.
Confirm a successful load before concluding zero
If Reports shows its incomplete-data warning, reload the browser page and wait for loading to finish; Last Refreshed alone does not prove every source succeeded. In analytics, use Refresh after a load error: a failed traffic request can leave earlier traffic figures on screen, while failed outcome queries can appear as zero even when traffic loaded successfully. The classic analytics panel does not show every outcome-query warning, so an unexplained zero is not proof that no activity occurred.
When the totals still differ
Summary
The worked difference is expected: three events create seven report memberships, a drawer filter narrows that to one row, and a late local-night visit can land in the next UTC chart day. Reconcile those definitions and boundaries first, then investigate missing or failed data.